
How do Doppler Wind LiDARs Work
What is doppler effect?
Wind Lidars are based on the theory of Doppler effect. The following is an overview of LiDAR Solutions and what describes what is Doppler effect.
In 1842, Doppler, an Austrian mathematician and physicist, passed by the railway and a train passed him. He found that when the train came from a distance, the sound of the whistle became louder and the pitch increased, and when the train was leaving, the sound becomes weaker and the pitch lowers.
Learn more from the video below – Brass band on train demonstrates Doppler effect
This physical phenomenon has aroused great interest in Doppler, and the following conclusions have been drawn after research.
When the sound source moves toward the observer, the wavelength of the sound wave decreases (the frequency increases), so the pitch increases; when the sound source moves away from the observer, the wavelength of the sound wave increases (the frequency decreases), so the pitch decreases as demostration below:
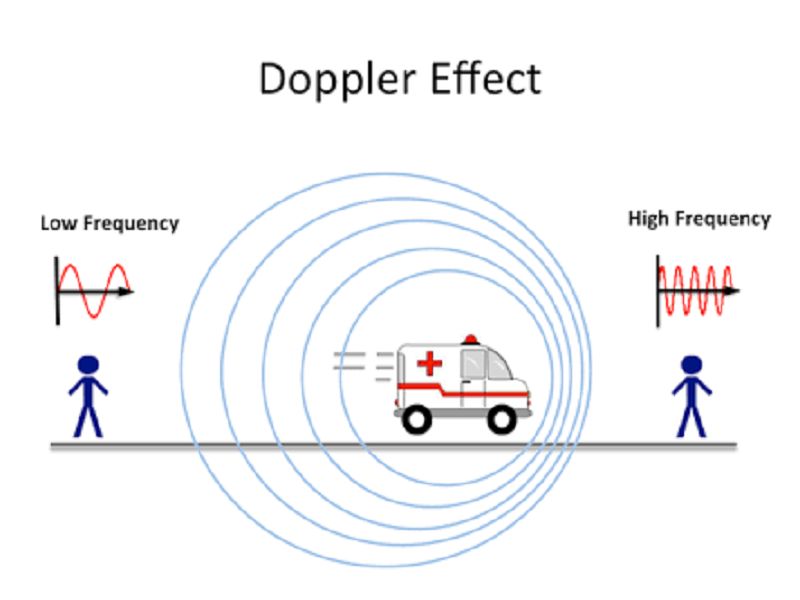
The change in pitch is related to the ratio of the relative velocity to the sound velocity between the source and the observer. The larger the ratio, the more significant the change, which is the “Doppler effect”, and the resulting frequency change is called the Doppler shift.
The mathematical expression of the Doppler effect:
The frequency relationship between the observer and the source is
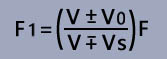
F1 is the observed frequency;
F is the original emission frequency at which the emission originates from the medium;
V is the traveling speed of the wave in the medium;
V0 is the movement speed of the observer. If it is close to the emission source, the front operation symbol is +, otherwise, it is -, and the observer is stationary, it is 0;
Vs is the moving speed of the emission source. If it is close to the observer, the front operation symbol is – sign, otherwise, it is + sign.
The Doppler effect applies not only to sound waves, but also to radio waves and light waves.
Working Principle of Doppler Wind LiDAR
Wind LiDAR has many complexities. There are many aerosol particles in the air, which refer to solid particles and liquid particles uniformly dispersed in the atmosphere, such as fog, smoke, haze, fine dust and smog. The wind-measuring lidar emits a laser beam into the air, and when the laser irradiates these aerosol particles, it will reflect, and the reflected wave of the moving particles will have a Doppler frequency shift. The frequency shift is the difference between the frequencies of the transmitted wave and the reflected wave.
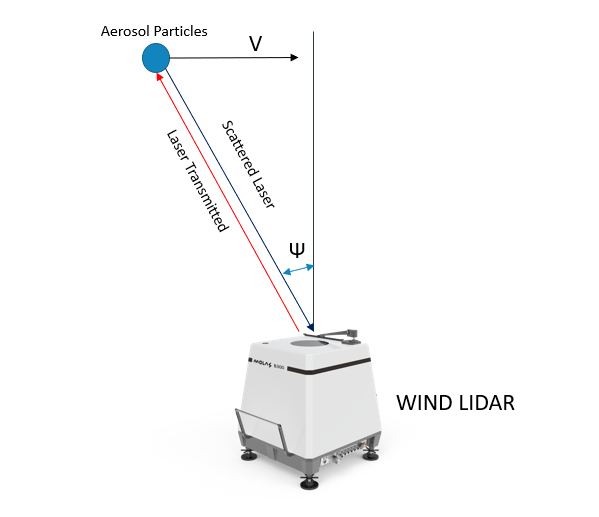
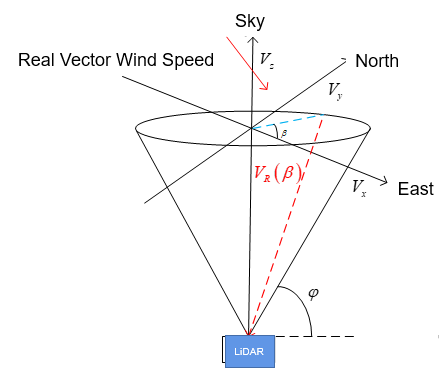
In the figure below, the angle between the laser wave emitted by the lidar and the vertical line on the ground is φ. The laser will be reflected when it encounters aerosol particles, and the lidar will process the reflected wave after receiving it. The distance L between the aerosol particle and the radar is obtained by the time difference between the aerosol particle of the transmitted wave and the received wave
The height of the aerosol particle h=L·cosφ
The velocity Vs of the aerosol particles relative to the radar is calculated by the frequency shift Δf of the transmitted wave and the received wave,
The horizontal moving speed of aerosol particles V=Vs sinφ
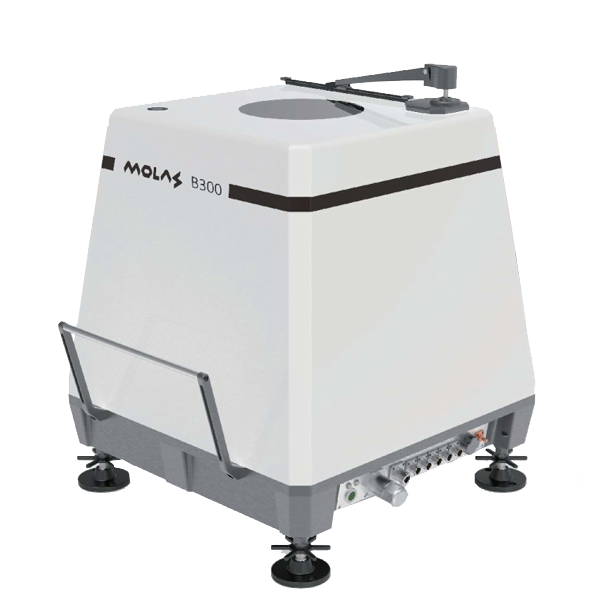
The internal structure of the doppler Wind monitoring LiDARs:
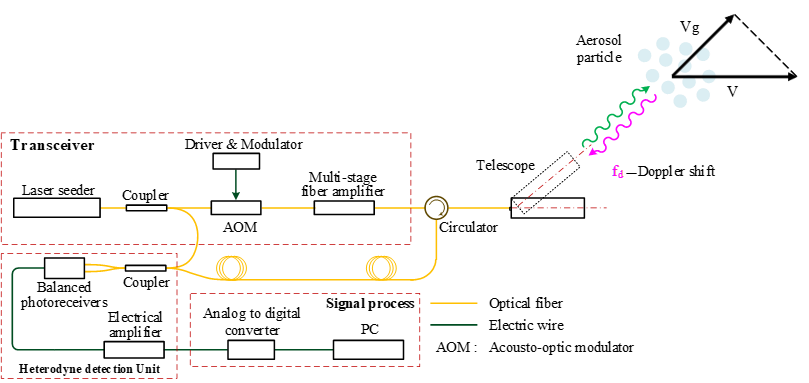
The horizontal moving speed V of aerosol particles is only the speed toward the vertical line z of the lidar, not the actual wind direction and speed. To get the actual wind direction and wind speed, LiDAR needs to send more laser beams into the air and reconstruct wind speed of wind fields.
It may seem simple, but it is actually very complex. The atmosphere is full of aerosol particles, and the reflected waves are very complex as well. It is a superposition of a large number of reflected waves. How to select the desired wave from the massive clutter is very complicated. Technology can only be solved by using precise analog and massive digital processing technology. Therefore, the current cost of lidar wind measurement is still very expensive, but with the improvement of device performance, the price will gradually decrease.
Types of doppler wind measurement lidar
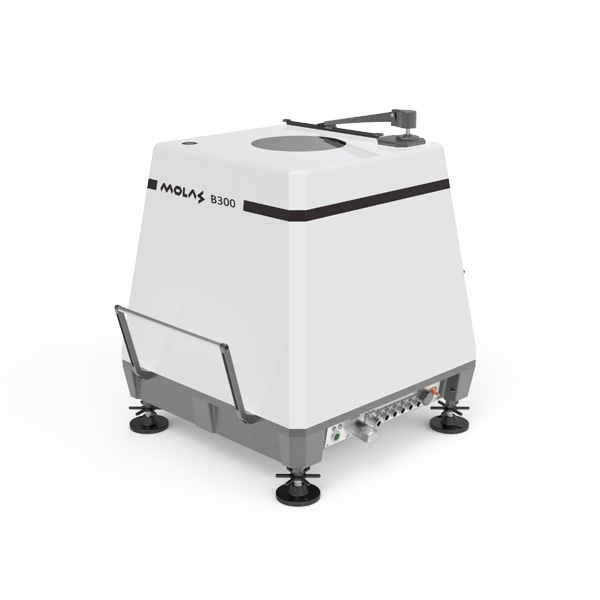
Key Features
Bankable: fully classified by DNV-GL against DNV-GL according to IEC61400-12-1 ed2, and verified by Windguard and DTU;
Measuring distance: from 30 to 300m, with 12 configurable heights;
Robust design: State-of-Art design and manufacturing, with IP67 protection which can be deployed in harsh environment;
Complex terrain support: complex wind measurement data re-construction with no extra cost
Can operation in various site condition: proven experiences in sites with high altitude, high/low temperature & heavy rainfall area.
Applications - Molas B300 Doppler Wind Measurement LiDAR System
Onshore wind farm development projects:
- Applied after wind farm development feasibility study and before or at micro-siting, to assess wind energy output in specific locations for 3 to 6 month;
Onshore Power Curve Validation:
- Replace the traditional Met-mast to setup at 2.5D away from the wind turbine
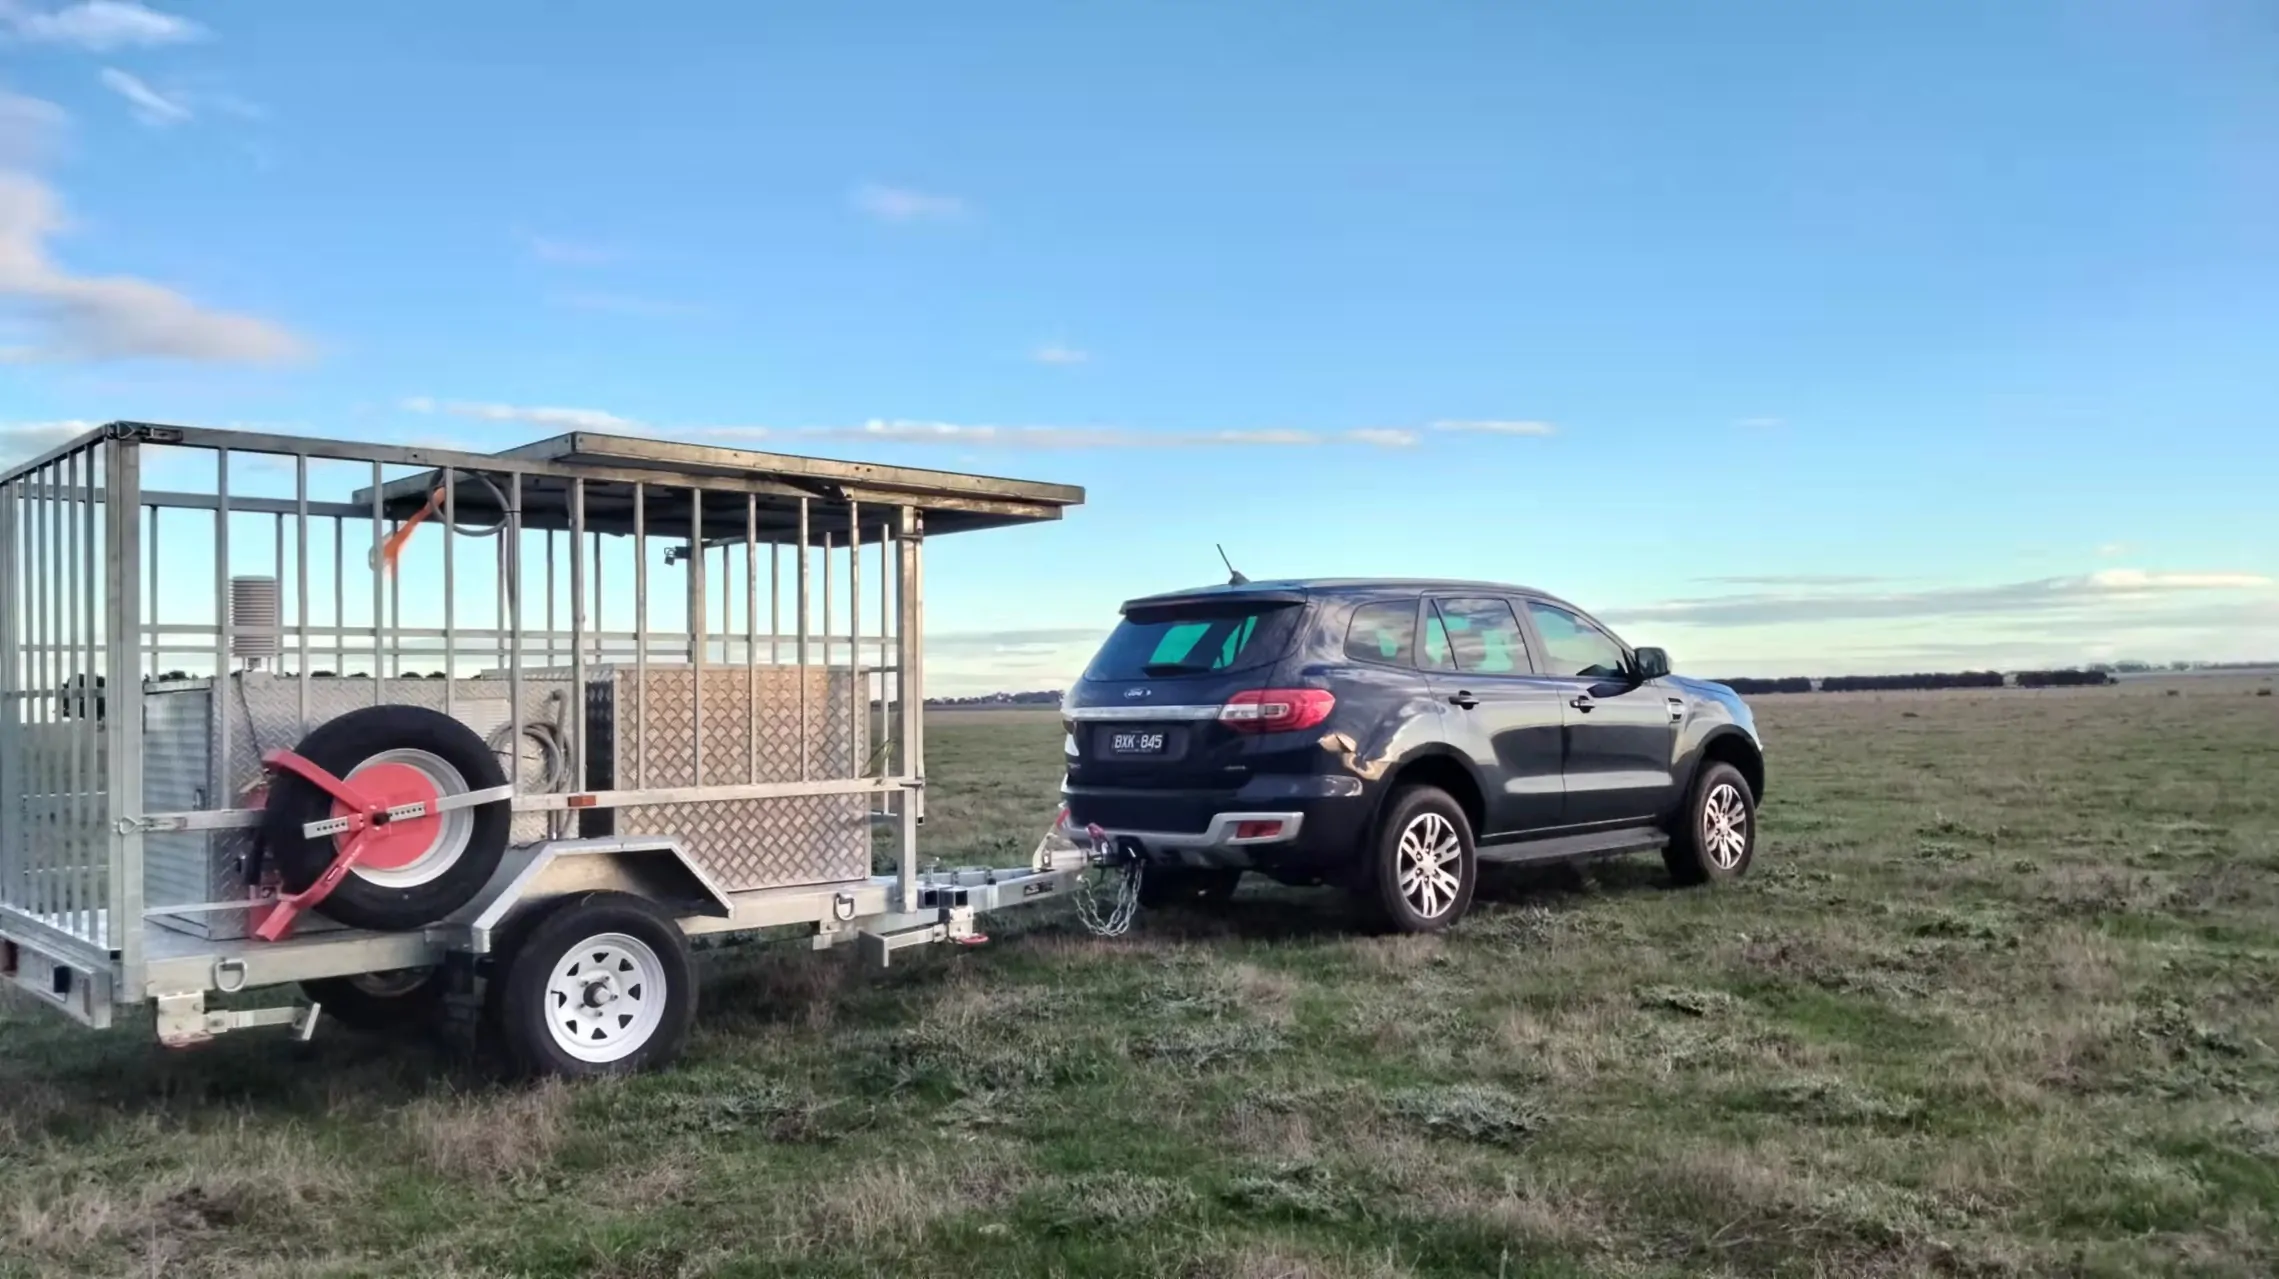
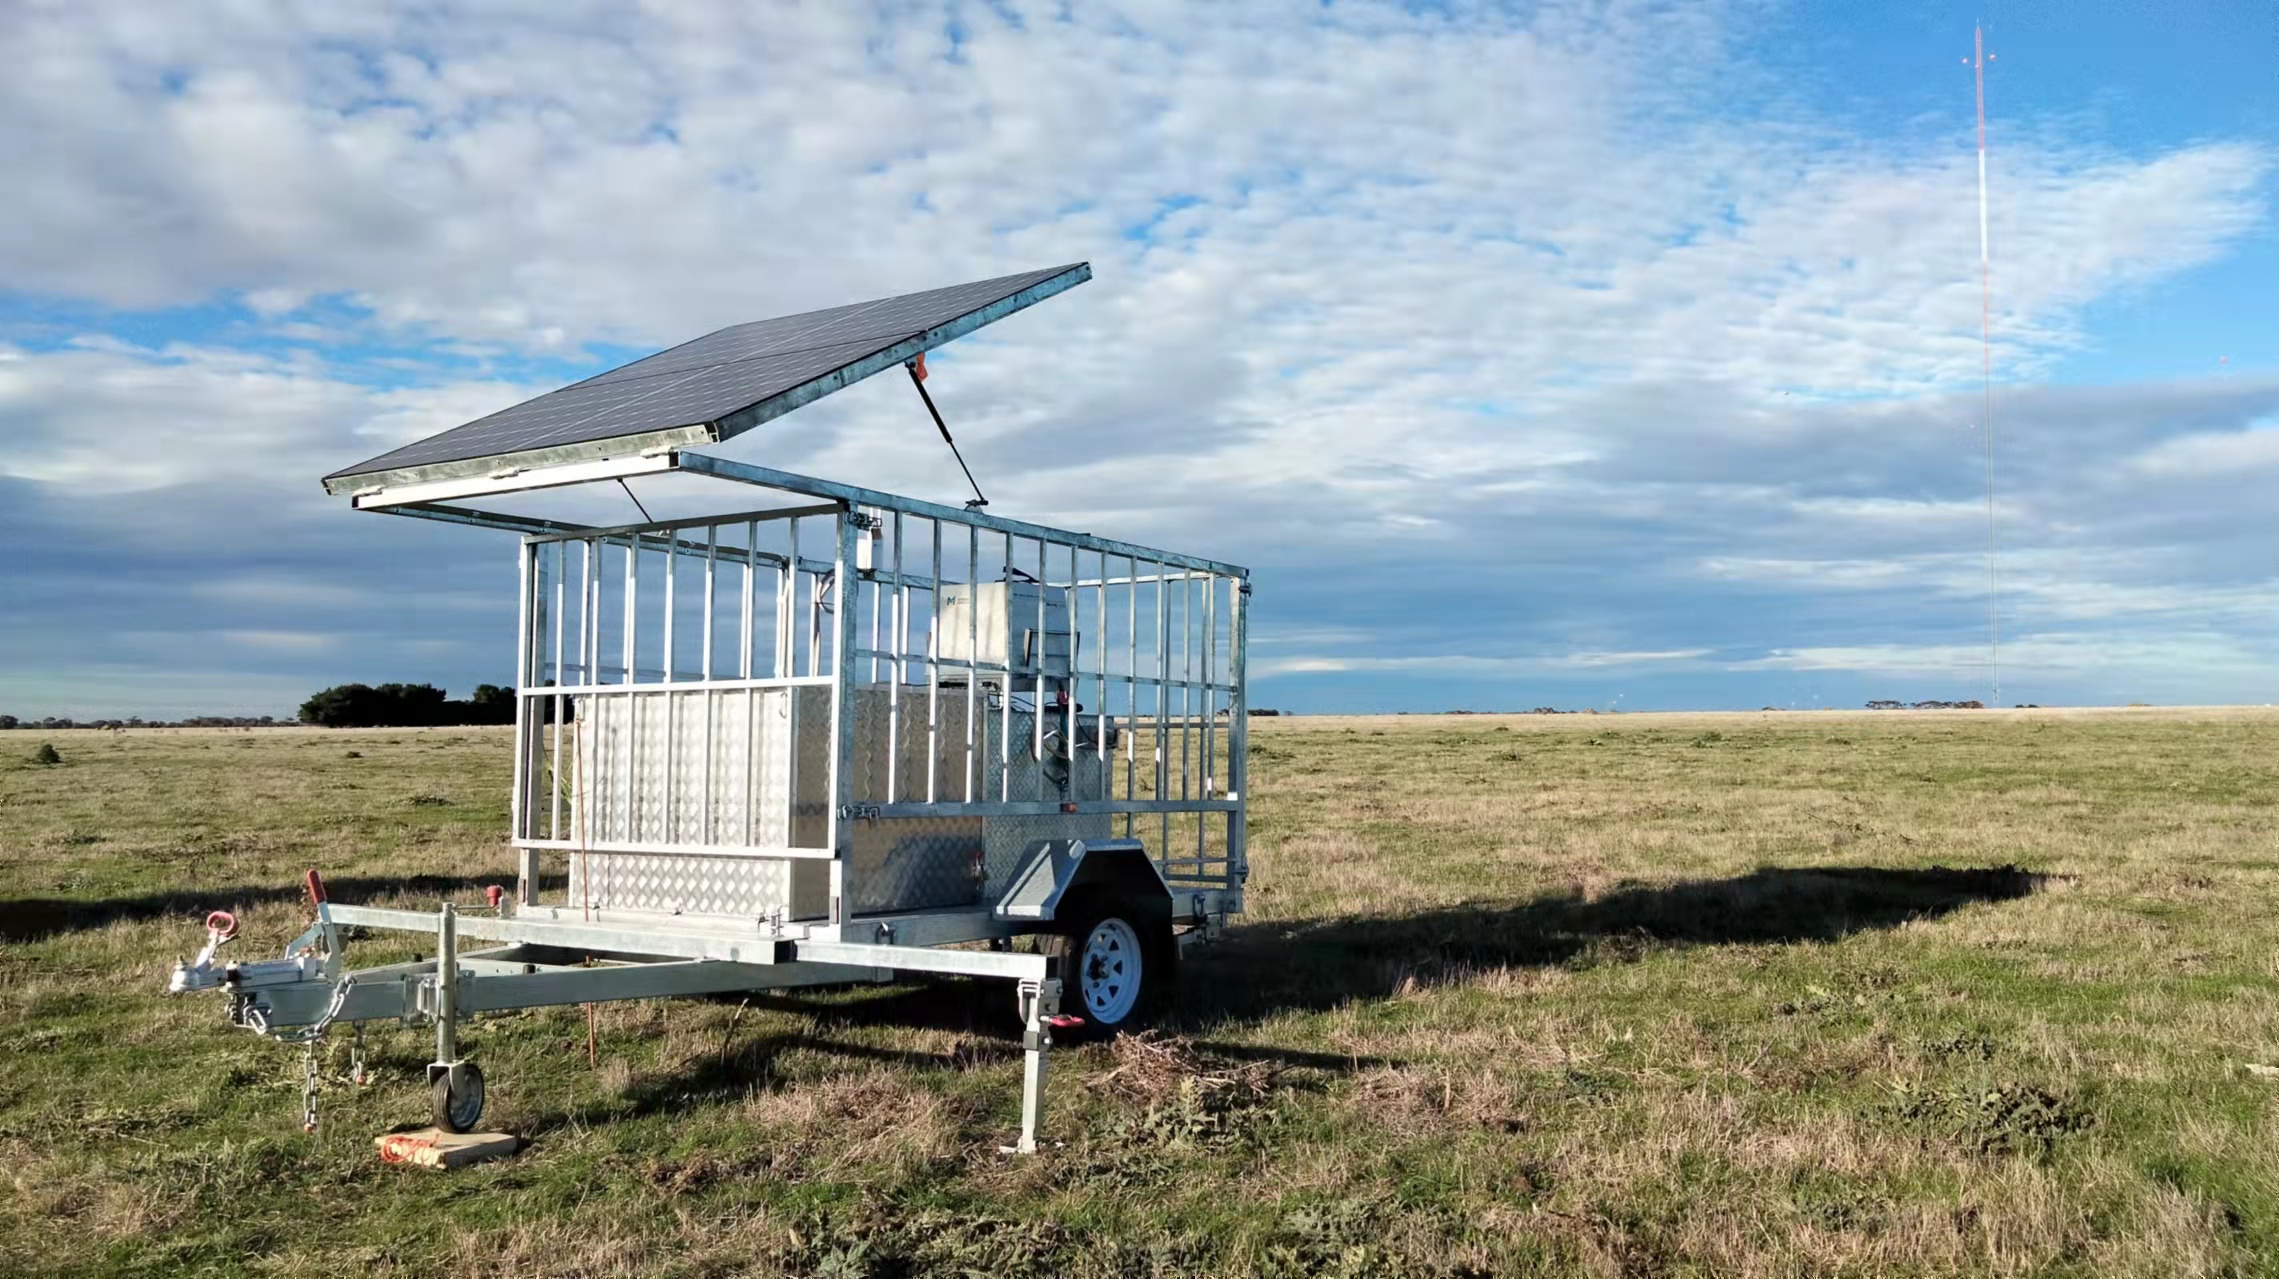
Key Features
All-inclusive: LiDAR, power supply, and communication system are all included
Portable: the whole system can be transported with 4X4 trailer
Easy to Operate: can be setup by 2 technicians within half an hour after the system arrives on site
Great quality: no comprise considered when talk about quality.
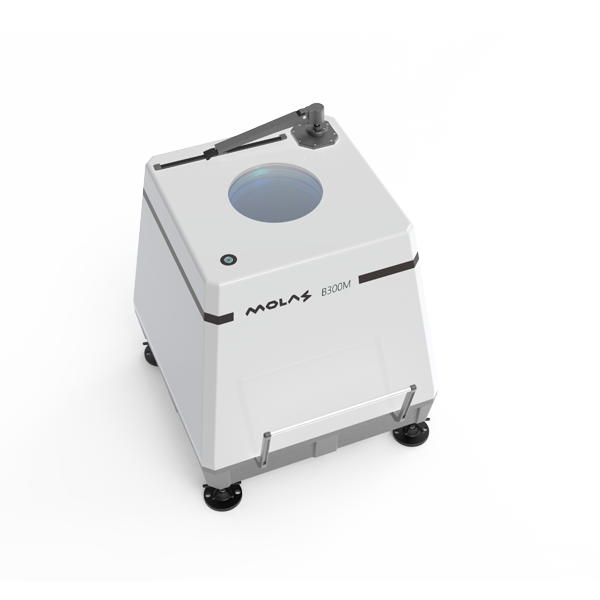
Key Features
Measuring distance: from 30 to 30m, configurable;
Easy to mobilise and setup: smaller dimensions and weight, comparing to the similar lidar products in the market;
High accuracy: Motion attitude correction algorithm secured accuracy ≤ 0.3m/s
Unattended: Satellite data communication and equipment status monitor
Strong robustness: can work stably and continuously under harsh offshore condition
Applications- Molas B300M Wind Monitoring LiDAR
Offshore development projects:
- Applied after wind farm development feasibility study and before or at micro-siting, to assess wind energy output in specific locations for 3 to 6 month;
Offshore power Curve Validation:
- Replace the traditional Met-mast to setup at 2.5D away from the wind turbine
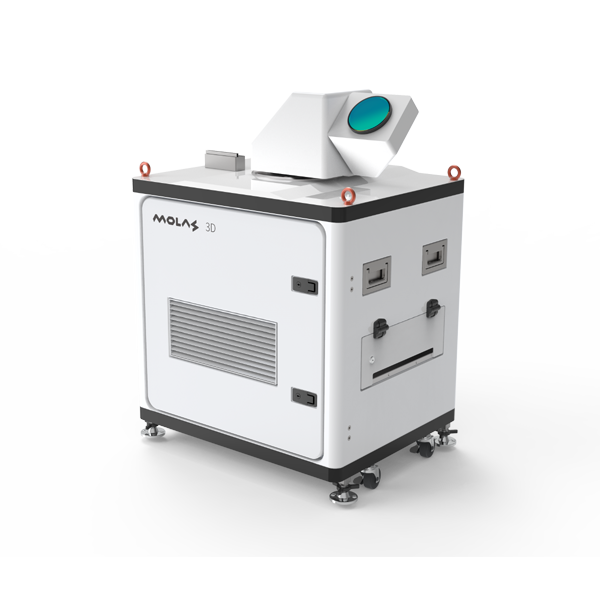
Key Features
Measuring distance: from 45 to 10,000m, configurable;
Easy to mobilise and setup: convenient for installation and transport, it is the lightest scanning wind measurement Lidar with the similar function in the industry;
Easy to access: can be configure with wireless and remote access;
Multi working modes available: Planar Position Indicator (PPI), Range Height Indicator (RHI), Doppler Beam Swinging (DBS) & Spot Scanning mode.
Applications- Molas 3D
Meteorological detection and environmental monitoring
- National & International sports event wind condition measurement;
- Atmospheric pollution diffusion transport and diffusion meteorological conditions monitoring
Civil Aviation Weather
- Aircraft tail vortex measurement
- Airport wind shear detection
Applications in Wind Industry:
- Wind turbine wake measurement
- Wind energy measurement in complex terrain and shear analysis
- Wind farm power control the power according to the measured turbulence and wind turbine wake.
- Micro-siting for complex terrain wind farm
- More adaptable than WAsP to complex terrain.
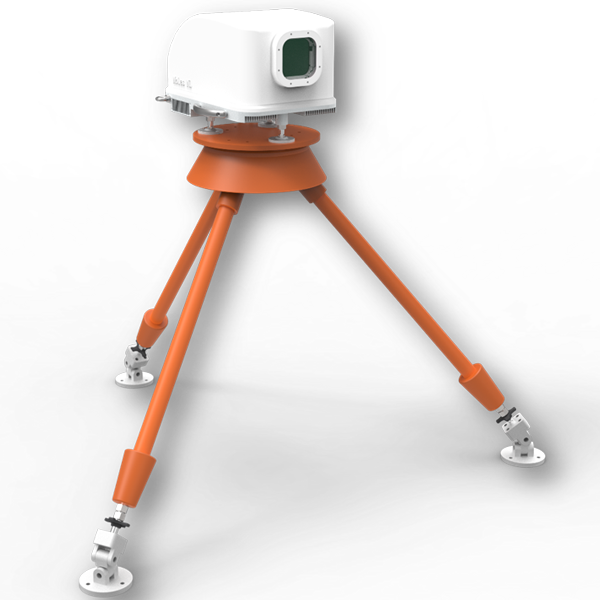
Key Features
Measuring distance: forward-looking from 50 to 400m, configurable;
Cost-effective: under massive production, more than 2,000 units have been deployed
Built-in wind turbine control algorithm:
- Built-in algorithm to measure static wind turbine yaw deviation
- Dynamic wind turbine yaw control
- Wind turbine blades occlusion algorithm (Patent), to increase the data acquisition rate
- Molas NL wind speed prediction algorithm
Designed for high reliability;
Applications
Wind turbine performance optimization:
- Molas NL wind Lidars can be eyes of the modern wind turbines to predict the wind change and then control the pitch and rotor speed to potentially reduce the mechanical fatigue, avoid the extreme load and increase the power output;
Power Curve Validation:
- Molas NL Forward-looking wind measurement Lidar can also be used for power curve validation as the independent wind speed source for the test. This is much more cost-effective than current testing equipment.